Profiling Lix with Tracy
Posted on by Teo Camarasu
Introduction🔗
Nix evaluation can be slow, especially as projects grow in size and complexity. NixCpp has some great tools for investigating this slowness like a stack sampling profiler and a warning on copying large paths into the store. I have had success using these features to reduce my evaluation times in the past.
Yet, I have found myself still struggling to have a cohesive picture of where evaluation time is spent. This led me to experiment with using the wolfpld/tracy profiler to instrument Lix evaluation (which is the Nix implementation I happen to use). This turned out to be surprisingly effective, easy and fun. It has allowed me to cut our evaluation times at work in half and given me a really clear sense of where all the remaining time is spent.
Tracy is a profiler originally developed for games, and therefore has extremely low overheads.
It allows annotating a bit of your code with a Zone (if you are familiar with OpenTelemetry think of this as a span). A Zone usually corresponds to something like a function call. You can give it a name, and extra metadata.
Then Tracy gives you a nice UI for browsing your tree of Zones through time, viewing statistics about which classes of Zones are particularly slow, drilling into Zones by type, or creating a flamegraph.
How to use it🔗
To try this out, you can just clone my branch of Lix. And then build Lix like so:
nix develop
just setup
just install
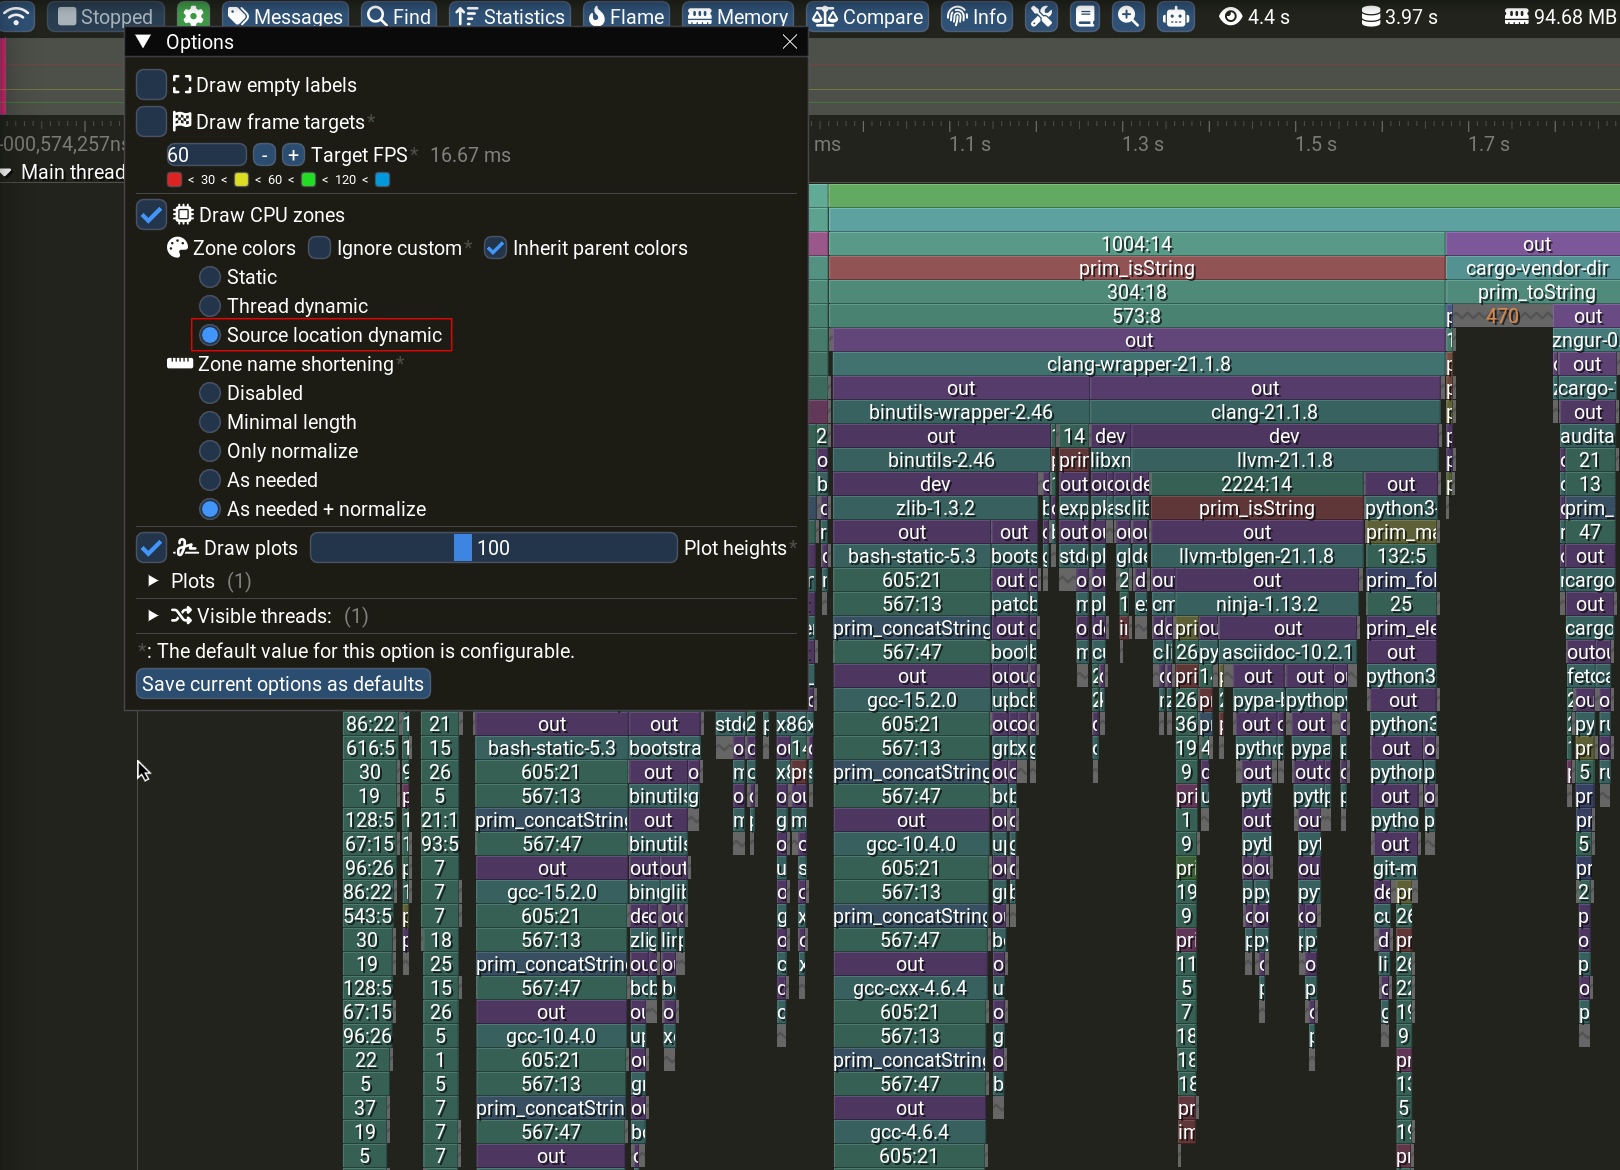
Then you can run the executables from the outputs/out/bin directory. You’ll also want to run a compatible version of tracy, eg, nix run nixpkgs#tracy_0_13. You’ll have to adjust the Zone colors setting to get useful colors by clicking the cog and picking “Source location dynamic”. Then you’ll get output like the following:
How it works🔗
My branch of Lix adds tracy as a dependency and adds a variety of annotations:
- each primop call is annotated with a Zone
- we add the name of the derivation to the
deriviationStrictprimop’s Zone - the name of the storepath produced to the
addPathprimop is added to its Zone - the
getAttrprimop is annotated by the attr we are looking up - we add a Zone for each function call and name those after the string you get in callstacks (this is a bit noisy but can give some extra context).
As the derivationStrict primop ends up evaluating all the inputs to a derivation, this really helps give you a sense of vaguely how much work each derivation is contributing to your evaluation time. Of course, because of lazy evaluation, this might not be completely clear. Some things might have been evaluated earlier.
I have also added a new primop, builtins.zone name e, which creates a zone for evaluating e and names it using name. You can drop this into your nix code and get sense of when and where things are being evaluated. Though, in practice, I have found that derivationStrict was already giving me a pretty clear idea of the call graph, and I didn’t end up using this too much.
Conclusion🔗
As you can see from my changes, this was all pretty easy to implement. I have found it quite helpful to edit things and add custom annotations using ZoneText, etc, and I would encourage you to do the same while investigating your own performance issues.
I have found that using tracy like this can give you a pretty nice overview of where evaluation time is being spent.
I’m currently not planning on upstreaming this branch because I see little value in doing so. One would need to make a custom build of Lix to use it anyway (since I feel like it would be unreasonable to always link with tracy), and then you might as well just check it out locally so you can hack on it and extend it at will!
I hope that others will find it similarly valuable for finding performance issues. Happy hunting!